

Because habits learnt as children, both good and bad, tend to stick with people throughout their lives, childhood is an important period not only for physical and mental development but also for the development of healthy lifestyles. According to the World Health Organization, a healthy lifestyle includes daily physical activity, a healthy diet, decreased inactivity, a normal body mass index (BMI) and a non-smoking environment (World Health Organisation [WHO], 2017). In Sweden, the vast majority of children and young people are healthy and engage in healthy lifestyles, as shown in health behaviours measured among them that continue to improve with age (WHO, 2018).
Even so, the physical activity of Sweden's children and young people has room for improvement. The WHO recommends that children and young people to be moderately physically active for at least 1 hour per day, ideally by engaging in physically strenuous, cardio-intensive activities, and to engage in activities that strengthen the body at least three times per week (2010a). Being physically active can involve walking or cycling to school, engaging in various forms of sport, participating in activities at school or playing with friends. Physical activity confers numerous health benefits for school-age children and adolescents in terms of fitness, muscle strength, blood pressure, blood fat, bone density and BMI, with effects both in the short term and into adulthood (Strong et al, 2005; Janssen and LeBlanc 2010; Ekblom-Bak et al, 2018). Physical activity is also likely to improve the development of cognitive functions (Herting and Chu, 2017) and contribute to quality of life and psychological health (Hallal et al, 2006; Wu et al, 2017). However, according to the WHO (2010b), 81% of school-age children and young people in the world move too little and spend many of their waking hours engaging in sedentary activities instead, often ones involving screens (LeBlanc et al, 2015; Bucksch et al, 2016). In particular, physical activity and outdoor play decrease with age, and girls have tended to demonstrate lower levels of activity than boys (Pagels et al, 2014; Elinder et al, 2014).
For all individuals throughout their lives, a nutritious diet should accompany physical activity as an essential component of a healthy lifestyle. Healthy eating and regular physical activity not only promote good health and wellbeing but can also prevent disease. Beyond that, a healthy diet supports children and young people's growth, development and fitness and reduces the risk of deficiency diseases, obesity, tooth decay and, in the long term, heart disease, cancer and stroke (Story et al, 2002). Many circumstances affect the dietary habits that children and young people develop, habits that often persist into adulthood (Lien et al, 2001; Craigie et al, 2011) such as socio-economic factors (Vereecken et al, 2005), what their families and peers eat and what is available in the various environments where they spend their time, including school (Fitzgerald et al, 2010; Sleddens et al, 2015).
Despite that advice for healthy living, overweight and obesity are widespread among children and young people (Kark and Rasmussen 2005; Blomquist and Bergström 2007; Frederick et al, 2014; Chung et al, 2016) and on the rise both in Sweden and around the world (Abarca-Gómez et al, 2017). The Nordic Nutrition Recommendations (2012/2014) include guidelines for nutrient intake and physical activity to fulfil physiological requirements as well as prevent lifestyle-related chronic diseases. Therein, the characteristics of diets associated with a lower risk of lifestyle-related chronic disease in adults also apply to children more than 2 years of age, including the limited consumption of sugar-sweetened beverages, sweets, ice cream and candy. The risk of childhood obesity can thus be reduced by instiling healthy dietary habits and promoting active lifestyles during childhood (Nordic Council of Ministers, 2014).
Another habit, smoking tobacco, also typically becomes established during childhood – that is, prior to turning 18 years old (Prokhorov et al, 2006) and is well documented to increase the risk of several diseases, including cancer, cardiovascular disease, and diabetes. The surrounding environment and whether parents, teachers and/or peers smoke greatly influence whether children and young people begin smoking (Rasmussen et al, 2005; Øverland et al, 2010; Joffer et al, 2014; Wellman et al, 2016).
Altogether, an unhealthy lifestyle characterised by limited physical activity, increased screen time, an unhealthy diet, and smoking or second-hand smoking is associated with some of the leading causes of disease, including overweight, obesity, diabetes, cardiovascular disease, stroke and various cancers, and the loss of healthy years of life (Pagels et al, 2014; LeBlanc et al, 2015; Bucksch et al, 2016). However, the adverse consequences of unhealthy choices may be mitigated by healthy behaviours (Cuenca-García et al, 2013). In particular, researchers have suggested that multiple combinations of health behaviours should be considered to prevent obesity among children and adolescents (Gubbels et al, 2013; Veloso et al, 2012). In that light, addressing multiple health behaviours at once may help to illuminate temporal changes in BMI among children and young people.
Aim
We aimed to identify temporal patterns of change in body mass index (BMI) and associated health behaviour among 6–16-year-old children and young people in Sweden.
Methods
Design
A quantitative design was used with a sample of two population-based cohorts which were followed longitudinally.
Sample
The study's sample was comprised of individuals who had participated in Sweden's national school service health screening programme. Two cohorts were created. On the one hand, Cohort A included individuals in preschool (i.e. 6 years old, 2006–2007, n=1 655), the fourth grade (i.e. 10 years old, 2010–2011, n=2 098) and the seventh grade (i.e. 13 years old, 2013–2014, n=1 780). On the other, Cohort B included individuals in the fourth grade (i.e. 10 years old, 2007–2008, n=2 011), the seventh grade (i.e. 13 years old, 2010–2011, n=1 979) and the first year of high school (i.e. 16 years old, 2013–2014, n=1 694). The consent of all participants and/or their parents was collected, and the study was approved by the Ethics Committee in the Faculty of Medicine at Umea University (No. 2008-122M, 2013/91-31) and conducted according to the ethical principles recommended by the Research Council.
Measures
Physical activity
Physical activity was assessed with the question ‘In the last 7 days, how many hours have you been physically active? Physical activity is any activity that makes you warm (e.g. walking or cycling) or breathless (e.g. school sports, jogging, gymnastics, strength training, cycling, swimming, ball sports and dancing)’. The response options ranged from less than 1 hour to more than 10 hours on an 8-point scale in which physical activity for less than 1 hour was coded as 1 and physical activity for more than 10 hours was coded as 8.
Screen time (i.e. physical inactivity)
Screen time was assessed with the item ‘In my spare time, I sit in front of the TV or computer or with a tablet or mobile phone’. The response options ranged from 2 hours or less per day to more than 6 hours per day on a 5-point scale. Screen time for 2 hours or less per day was coded as 5 and more than 6 hours per day was coded as 1.
Diet
Intake of sugary drinks was assessed with the item ‘I drink soda, juice, energy drinks, sweetened tea and/or sweetened coffee’. Response options ranged from ‘Every day’ to ‘Never’ on a 5-point scale. Drinking sweet drinks every day was coded as 1 and never drinking sweet drinks was coded as 5.
Smoking environment
The smoking environment was evaluated with the question ‘Does anyone smoke indoors where you live?’ The response options were either ‘Yes’, coded as 0, or ‘No’, coded as 1.
BMI
An established measure of overweight and obesity that is often used in research, BMI was calculated as weight divided by height squared. For children and adolescents, BMI varies with age and gender, hence age- and gender-specific limits for overweight and obesity. Based on the limits for obesity developed by Cole et al (2000), BMI was recorded as ‘Underweight’, ‘Normal weight’, ‘Overweight’ and ‘Obese’. Anthropometric measures were taken by school nurses in the Swedish health service in connection with the national health screening programme. Body height was measured by a stadiometer attached to the wall; participants were asked to remove their footwear and stand with their backs against the wall with their feet together. Body weight was measured using Class III medical scales; participants were instructed to take off any heavy clothes (e.g. sweaters), empty their pockets and remove their belts and footwear.
Data analysis
To assess the independent association between time and BMI, we formed two age-overlapping cohorts, as previously described, and conducted explorative data analysis (von Eye and Mair, 2008). The first step of analysis was to identify the prevalence of the different categories of BMI in the cohorts (Table 1). After that, the second step was to determine the health behaviours characterising the categories of BMI in the two cohorts (Table 2), which was done using a mean z score and stacked fractions figure. The third step involved a visualisation of the different BMI categories' pattern of change throughout the school years using configural frequency analysis (CFA). CFA is a widely used method of explorative data analysis. It detects patterns in the data that occur significantly more or less often than expected by chance. Patterns that occur more often than expected by chance are called CFA types, whereas those that occur less often than expected are called CFA antitypes. The patterns detected are used to generate knowledge about the mechanisms underlying the data (von Eye and Mair 2008). The fourth and final step of analysis was taken to model the patterns of change and predict Cohort A's BMI in high school. A generalised linear model was used to predict BMI (Harrison et al, 2017). The statistical package SPSS version 25.0 was used for all statistical analyses.
Table 1. BMI categories of the cohorts (n and %1)
| Cohort A n (%) | Cohort B n (%) | ||||
|---|---|---|---|---|---|
| Girls | Boys | Girls | Boys | ||
| Preschool | Normal | 596 (73) | 674 (77) | ||
| Overweight | 152 (19) | 127 (14) | |||
| Obese | 55 (7) | 55 (6) | |||
| 4th grade | Normal | 735 (72) | 784 (72) | 707 (72) | 746 (72) |
| Overweight | 214 (21) | 212 (20) | 200 (20) | 220 (21) | |
| Obese | 63 (6) | 70 (6) | 56 (6) | 57 (6) | |
| 7th grade | Normal | 673 (75) | 637 (73) | 726 (76) | 720 (71) |
| Overweight | 166 (18) | 164(19) | 174 (18) | 204 (20) | |
| Obese | 33 (4) | 65 (7) | 49 (5) | 75 (7) | |
| 1st year high of school | Normal | 442 (58) | 522 (56) | ||
| Overweight | 94 (12) | 162 (18) | |||
| Obese | 37 (5) | 74 (8) | |||
The percentage does not add up to 100 because the underweight group is not described.
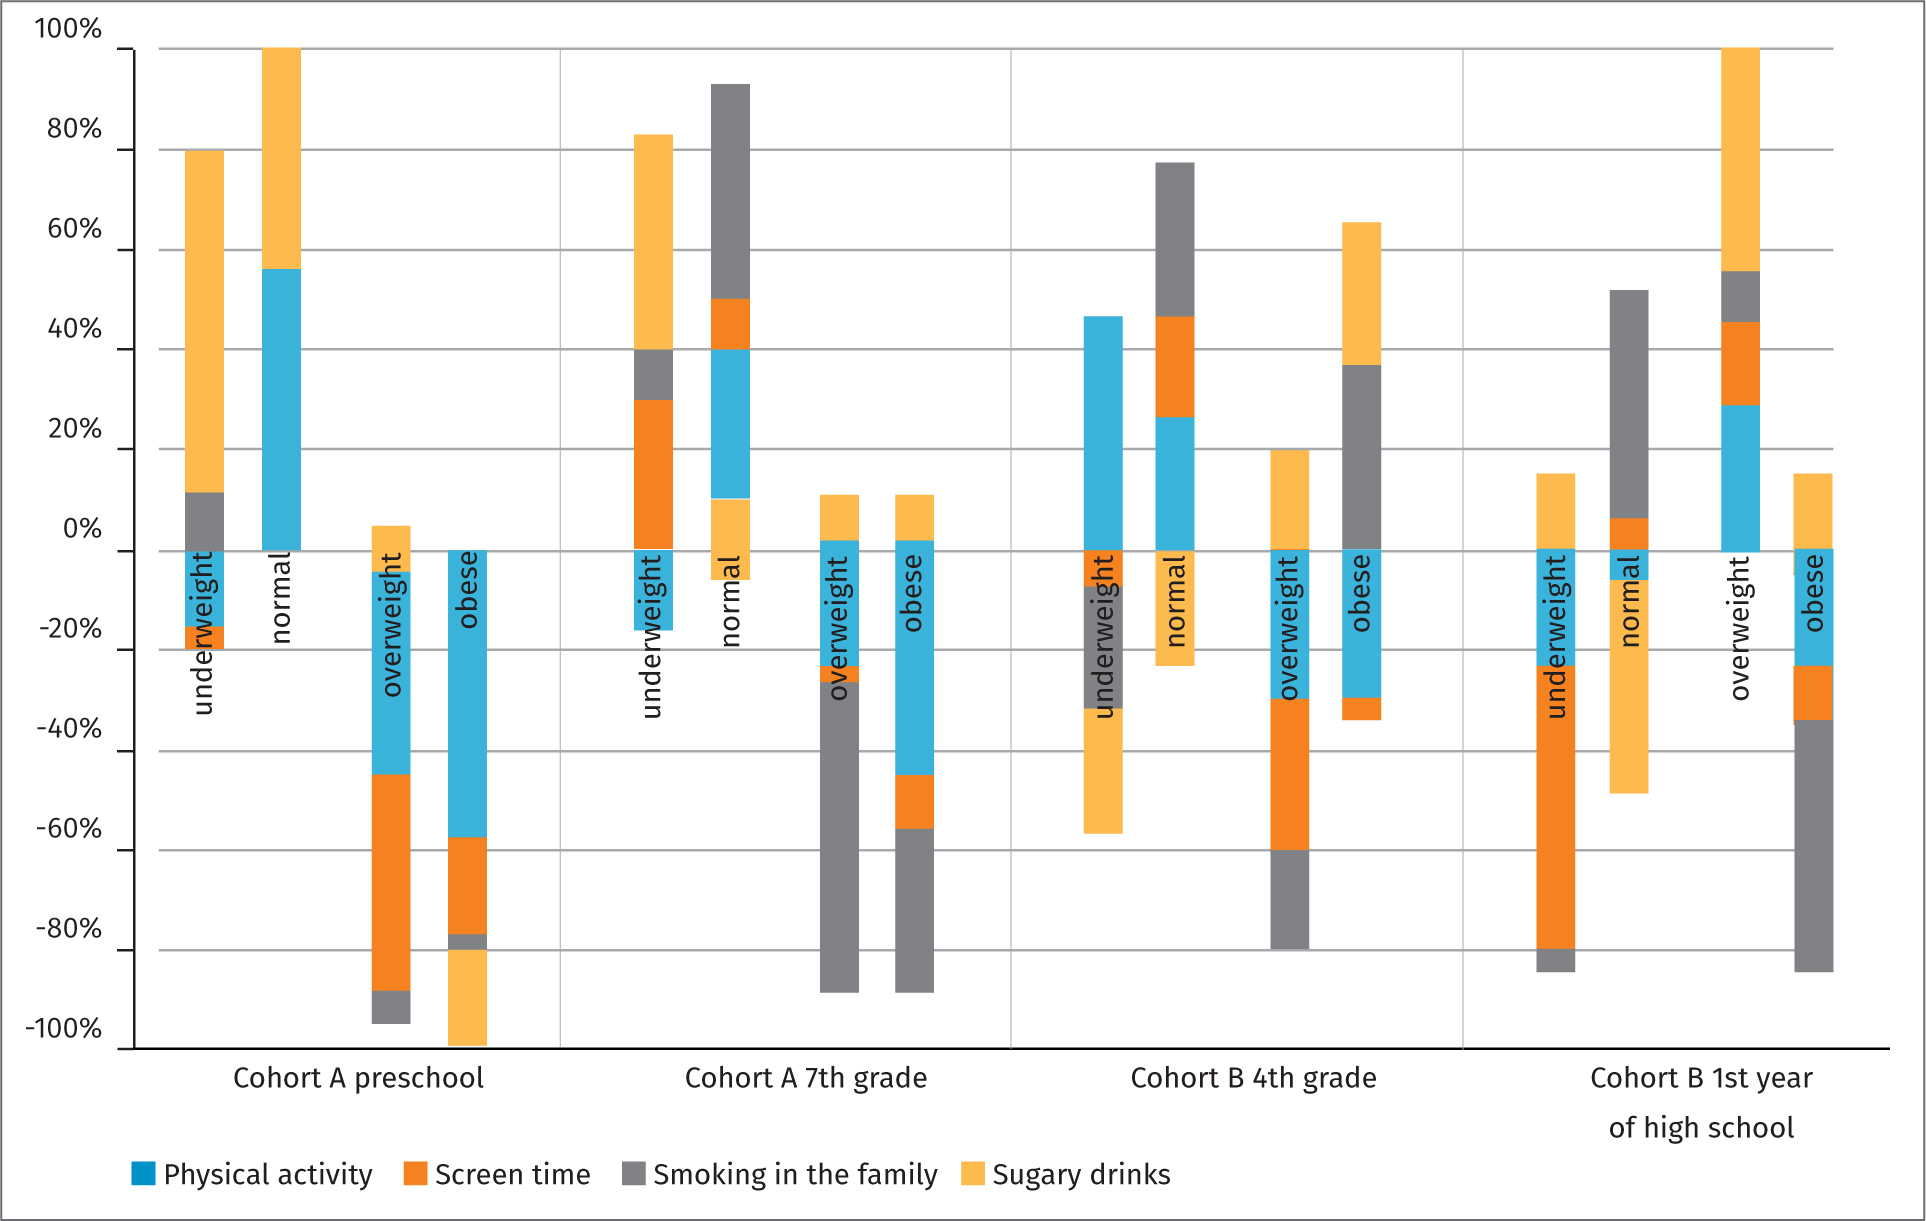
Table 2. Descriptive statistics of health behaviours within bmi categories (mean z-scores)
| Physical activity | Screen time | Smoking In the family | Sugary drinks | |||
|---|---|---|---|---|---|---|
| Cohort A | Preschool | Underweight | -0.04 | -0.10 | 0.03 | 0.17 |
| Normal | 0.05 | 0.04 | 0.00 | 0,00 | ||
| Overweight | -0.09 | -0.12 | -0.01 | 0.01 | ||
| Obese | -0.37 | -0.13 | -0.02 | -0.14 | ||
| 7th grade | Underweight | -0.10 | 0.17 | 0.07 | 0.26 | |
| Normal | 0.04 | 0.01 | 0.05 | -0.01 | ||
| Overweight | -0.05 | -0.01 | -0.14 | 0.01 | ||
| Obese | -0.33 | -0.09 | -0.29 | 0.04 | ||
| Cohort B | 4th grade | Underweight | 0.23 | -0.5 | -0.14 | -0.11 |
| Normal | 0.03 | 0.02 | 0.04 | -0.03 | ||
| Overweight | -0.04 | -0.05 | -0.03 | 0.03 | ||
| Obese | -0.23 | -0.07 | 0.35 | 0.25 | ||
| 1st year of high school | Underweight | -0.27 | -0.62 | -0.04 | 0.18 | |
| Normal | -0.01 | 0.01 | 0.06 | -0.06 | ||
| Overweight | 0.09 | 0.03 | 0.04 | 0.13 | ||
| Obese | -0.22 | -0.05 | -0.42 | 0.13 |
Results
School-age children and young people tended to maintain their categories of BMI established at the age of 6 years (i.e. Cohort A) or when they entered the fourth grade (i.e. Cohort B), and the categories were stable in age and gender over time.
BMI prevalence
The results indicate that the participants in the different categories of BMI largely remained in those categories over time. In Cohort A, at least 70% of the girls stayed in the normal BMI category from preschool until the seventh grade (73%, 72% and 75%), as did the boys (77%, 73% and 73%). In Cohort B, the percentage of children and young people of both genders in the normal BMI category dropped between the fourth and seventh grades to the first year of high school, from approximately 70% to 58% of young women and to 56% of young boys (Table 1).
Identified behavioural clusters
As shown in Figure 1, the health behaviours of the preschool participants in Cohort A were divided into positive behaviours in the underweight and normal BMI categories and negative behaviours mostly in the overweight and obese categories. Those patterns were mostly stable in Cohort A until the seventh grade. In Cohort B, however, the factions were more diverse. Although the normal BMI category also consisted mostly of positive health behaviours, both the obese category in the fourth grade and the overweight category increased during the first year of high school. All in all, no obvious pattern of healthy behaviours in relation to BMI emerged in Cohort B.
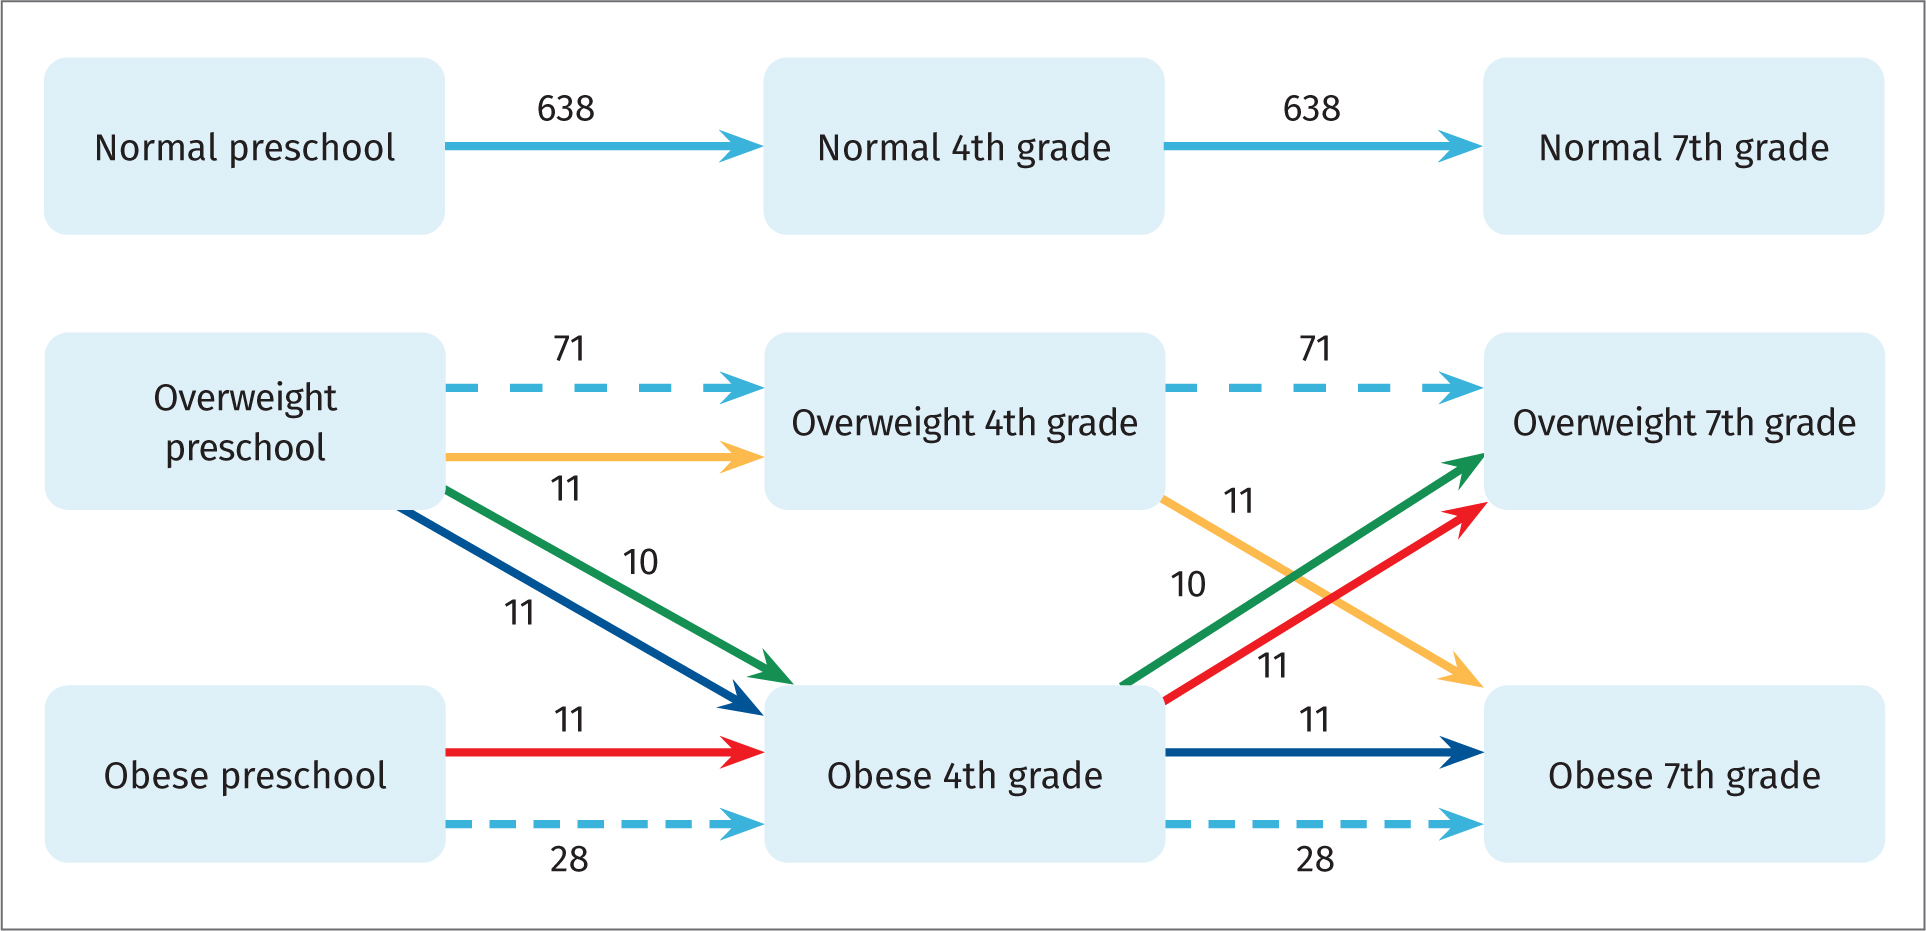
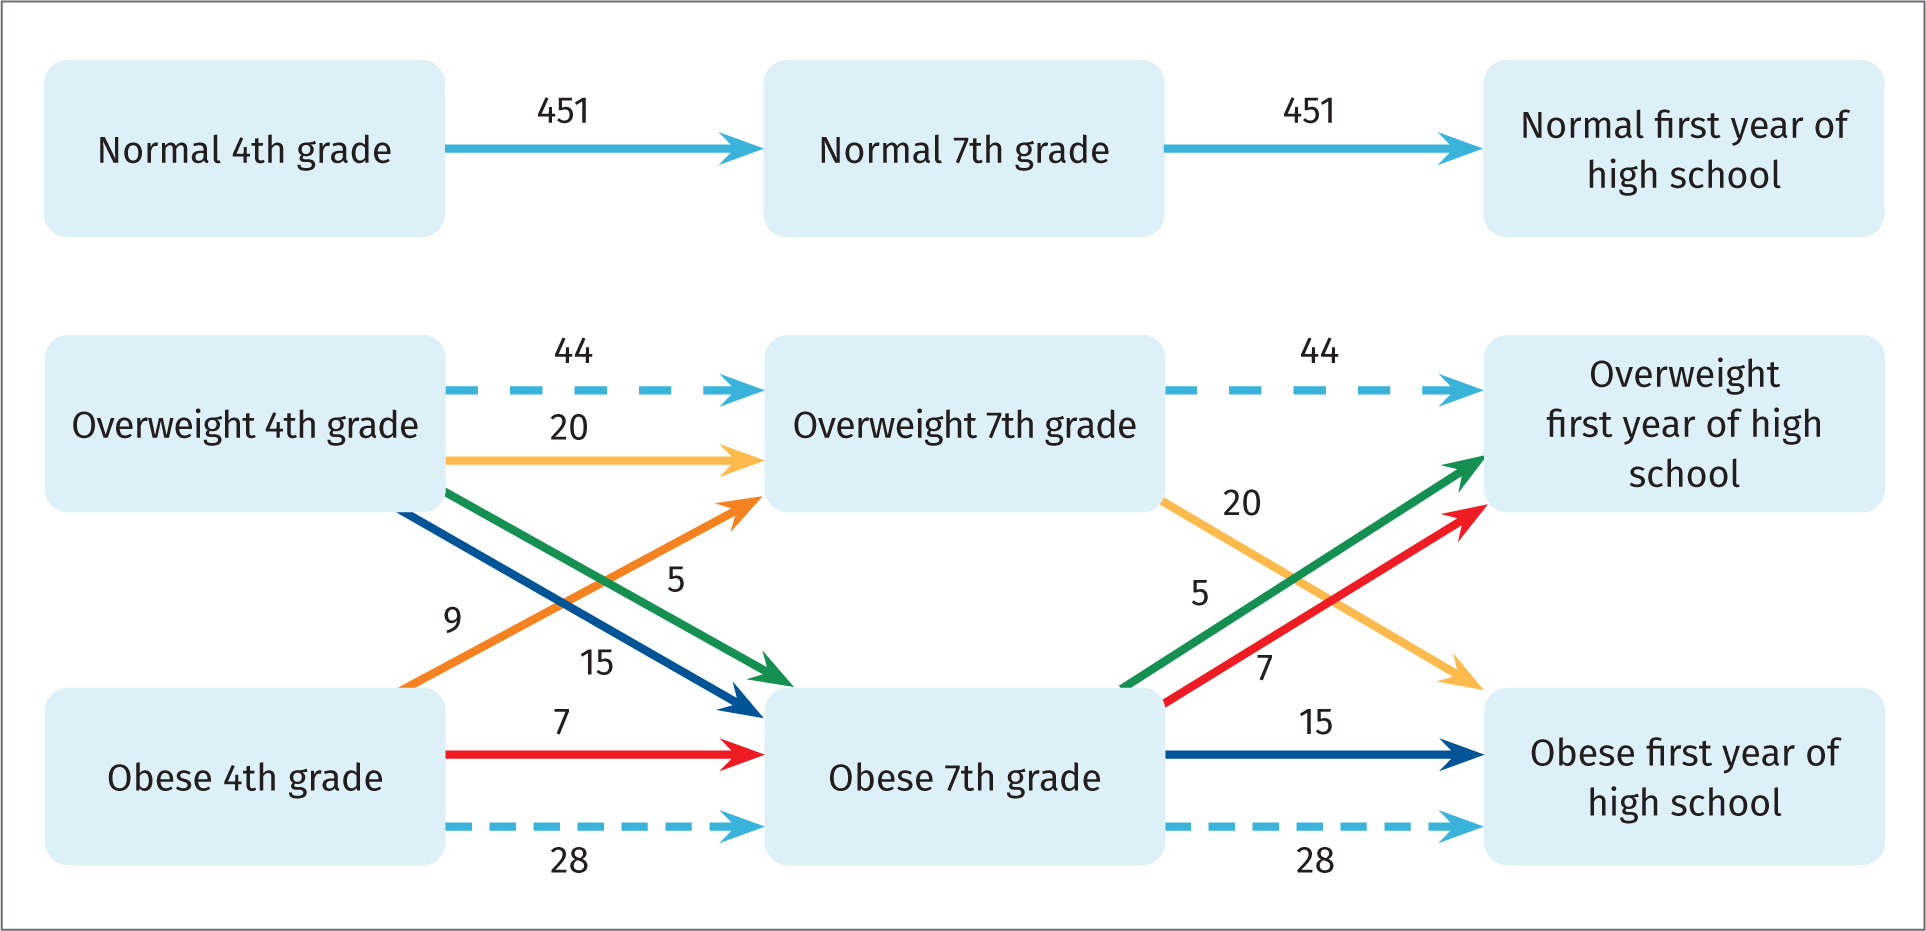
Temporal patterns and categories of BMI
As shown in Figures 2 and 3, despite some significant temporal changes in the sample between categories of BMI over time, the most common trajectory in both cohorts was to remain in one's initial BMI category. Even so, a net increase occurred from the overweight group to the obese group both between preschool and the seventh grade in Cohort A and between the fourth grade and the first year of high school in Cohort B.
Concerning the participants' health behaviours in connection with their temporal category, patterns in the normal BMI category were the same for both Cohorts A and B. In fact, all the health behaviours demonstrated the same pattern of becoming increasingly healthy over time – for example, drinking fewer sugary drinks, being more physically active, engaging in less screen time and not smoking.
Predicting future BMI category
When BMI in preschool and BMI in the fourth grade were used to predict BMI in the seventh grade, the population mean differed by only 1% for both girls and boys. However, when predicting BMI for the first year of high school based on BMI in the fourth and seventh grades, the mean differed by only 1% among the girls but by 5% among the boys.
Discussion
Our study revealed no significant transitions between the normal trajectory and the two other trajectories in either cohort. The BMI category established in preschool largely persisted until the age of 16 years, which suggests that personal shifts in BMI categories across the school-age years are unlikely.
The relationship between health behaviours and obesity is highly complex, as reflected by inconsistent findings regarding the association, if any, between cluster patterns in health behaviours and BMI. Whereas some studies have shown no association between health behaviours and being overweight (Leech et al, 2014), others have shown a higher prevalence of being overweight in unhealthy clusters (Veloso et al, 2012). When Nuutinen et al (2017) examined how cluster patterns are associated with being overweight among adolescents in Finland, they found a greater risk of being overweight among girls in the unhealthy cluster even though being overweight was more prevalent overall among boys. However, Marttila-Tornio et al (2020) found no significant differences in BMI among the health behaviour clusters that they identified. Such inconsistent findings regarding the association between health clusters and being overweight could have resulted from the fact that overweight and obesity may be more prone to emerge over the long term.
In preschool, overweight and obesity have not always been regarded as a problem (Bråbäck et al, 2009), partly because younger children are more physically active and play outdoors. However, a lower level of activity is usually reported in girls than in boys, and, regardless of gender, the tendency towards physical activity decreases with age (Pagels et al, 2014; Elinder et al, 2014). Obesity at the age of 4 or 5 years suggests a higher risk of obesity at the age of 10 (Timpka et al, 2007). In the United States, Nader et al (2006) found that 60% of all children who were overweight between 2 and 5 years of age were also overweight at 12 years of age. Most excess weight before puberty is gained before 5 years of age, meaning that weight at 5 years of age bears little relation to birth weight but closely predicts weight at 9 years of age (Gardner et al, 2009).
A healthy diet, increased physical activity, decreased inactivity and a non-smoking environment promote good health and wellbeing and protect against disease. Although those factors are fundamental for good health for all individuals throughout their lives, they are especially influential for school-age children and young people, who are continuing to grow and whose future health behaviours are in the process of being developed.
The chief strength of our study was its longitudinal design and large representative sample of school-age children and young people in Sweden from a mainly rural region. Among its important limitations, the health behaviour variables were based on the self-report of school-age children and young people during health dialogues with the school health service, which could be regarded as a problematic method of data collection. However, the large sample size and the fact that the self-reported data were validated in health dialogues with the school nurses mitigate this limitation. The health dialogue process has been validated in several studies (Rising Holmström et al, 2013; Olofsson et al, 2015; Kristiansen et al, 2016). Furthermore, the height and weight measurements as well as the calculation of BMI were all performed by MSc-educated school nurses, which may have increased the data's accuracy.
Conclusions
Healthy behaviours affecting BMI should be established before children begin school. Although slight changes in children's categories of BMI may occur once they reach school age, the categories established at preschool generally persist at least until the age of 16 years. Because school-age children and young people generally maintain their BMI categories throughout their school years, we argue that there is evidence to increase focus on early prevention work and to provide resources for this work with particular focus on overweight and obese children and young people.
KEY POINTS
- Healthy behaviours affecting BMI should be established before children begin school.
- School-age children and young people generally maintain their BMI categories throughout their school years.
- The BMI categories established at preschool generally persist at least until the age of 16 years.
- There seem to be small changes in children's categories of BMI once they reach school age (6 years).
- There is evidence to increase focus on early prevention work and to provide resources for this work with particular focus on overweight and obese children and young people.
REFLECTIVE QUESTIONS
- Why is early prevention work focusing on overweight and obese children and young people important?
- Why is childhood an important period in life for the development of a healthy lifestyle?
- What does the WHO recommend for children and young people regarding physical activity and why?